


Yes you read it right, you can now access your access logs. How you ask? With the latest release of Clever Tools. But before we see how it works, let me explain what access logs are.
Access logs contain all incoming requests to a web server. They are available in different formats. One of the most common being CLF which stands for Common Log Format. Here’s an example where you can find the IP of the client, date, HTTP verb, URL target, status code and size of the answer: 255.255.255.255 - - [06/Feb/2020:07:59:22 +0100] "GET /aget/to/your/beautiful/website -" 200 1453
How to get your access logs
To get your access logs you need to use clever-tools and run this in a linked application:
clever accesslogs
You will get all the requests that came to this app in the last hour. This also work for most dedicated add-ons using --addon followed by the add-on id:
clever accesslogs --addon addon_41c5a60f-11c6-442a-9803-f4604fe8638b
You can also choose a date span using --after and --before like so:
clever accesslogs --after 2020-03-27 --before 2020-03-29
Any date you give must follow ISO 8601. You could for instance have a microsecond precision like this:
clever accesslogs --after 2020-03-29T11:01:02.120000Z --before 2020-03-29T11:01:02.123456Z
You can also change the format of the logs with -F (or --format):
clever accesslogs --after 2020-03-28 --before 2020-03-29 -F json
Here’s an example of JSON entry, it contains all of the information currently available for each request:
{
  "t": "2020-03-10T11:24:34.220324Z",
  "a": "app_87d748d4-3c7b-4baa-8f52-c748e1123ab3",
  "adc": "par-cleverapps-adc-n6",
  "o": "user_51f7098f-604e-4d9e-8fb6-4026fd1767bb",
  "i": "0805330e-cff6-4fd5-87c0-26974d8bcb4e",
  "ipS": "255.255.255.255",
  "pS": 38566,
  "s": {
    "lt": 48.6719,
    "lg": 1.3002,
    "ct": "Aunay-sous-Crecy",
    "co": "FR"
  },
  "ipD": "255.258.258.258",
  "pD": 11810,
  "d": {
    "lt": 48.7967,
    "lg": 2.3338,
    "ct": "Cachan",
    "co": "FR"
  },
  "vb": "GET",
  "path": "/status-codes/500",
  "bIn": 411,
  "bOut": 443,
  "h": "app-87d748d4-3c7b-4baa-8f52-c748e1123ab3.cleverapps.io",
  "rTime": "3ms",
  "sTime": "115μs",
  "scheme": "HTTPS",
  "sC": 500,
  "sT": "Internal Server Error",
  "w": "WRK-01",
  "r": "b6bcab8a-c6d0-4546-9000-57b43d009a49",
  "tlsV": "TLS1.3"
}
You will find the details for every field in our access logs documentation.
What you can do with your logs
Now let’s say you want to know what are the most returned status codes from a log file, here’s how you can do it:
clever accesslogs --after 2020-03-10 --before 2020-03-20 -F json | jq .sC | sort | uniq -c | sort -nr
Here we use the JSON format and jq to select the field we want, then sort and uniq to get a proper output, which would yield something like:
  99999 200
     56 500
     33 404
      2 400
      1 403
      1 301
      1 202
The first column being the number of hits and the second being the status code.
Now for something a bit more practical, here’s a script that allows you to split access logs for each day between two dates:
#!/bin/bash

input_start=2020-01-01
input_end=2020-03-27

startdate=$(date -I -d "$input_start") || exit -1
enddate=$(date -I -d "$input_end")     || exit -1

d="$startdate"
while [ "$d" != "$enddate" ]; do
  clever accesslogs --alias prod --after $d --before $(date -I -d "$bv d + 1 day") -F clf > access-$d.out
  d=$(date -I -d "$d + 1 day")
done
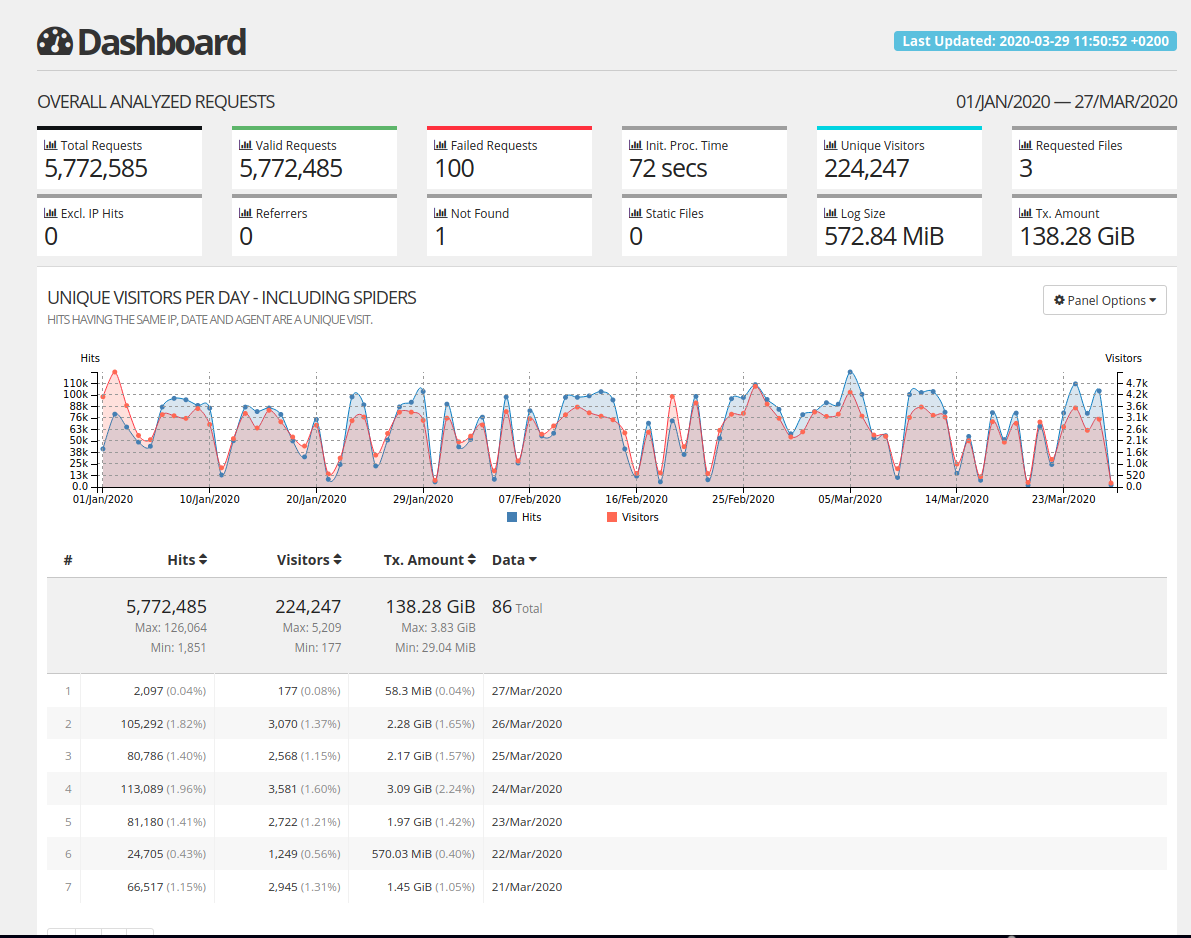
It’s hard to visualize so much data if you don’t have the proper tools. So I really invite you to try GoAccess. Combine the script above and this command goaccess access* -o report.html --log-format=COMMON --anonymize-ip. You will get this neat, anonymized HTML report:
There are of course lots of other tools you can use to visualize logs, like our latest Elastic add-on for instance 🙂 Or you can go straight into the metrics tab of your application or add-on and start playing with Warp10. This is actually what we use when you see the live map under the Overview tab of your application.
We hope you’ll find this new feature practical and as always welcome your input to make this better. Happy coding!