


In one of our previous posts, we announced the release of a dedicated Clever Cloud Grafana for all our metrics. What if now, you want to receive an alert when an application is in an abnormal state? Grafana provides an alerting service that is compatible with our Warp10 backend. Let’s see how we can create Slack alerts with our or any Grafana with a PromQL data source.
Grafana Notifier
First, before creating any alerts, we need to configure a Grafana notifier. You can have a full list of supported Grafana notifier here. However, you won’t be able to configure notifiers that require an admin access, like email or SMTP. In this example, we will configure a slack channel to receive all Grafana alerts.
Configure Slack
To be able to receive alerts on Slack, Grafana will ask for a web hook. The process to create one with slack is here. At the end you should obtain an active incoming web hook.
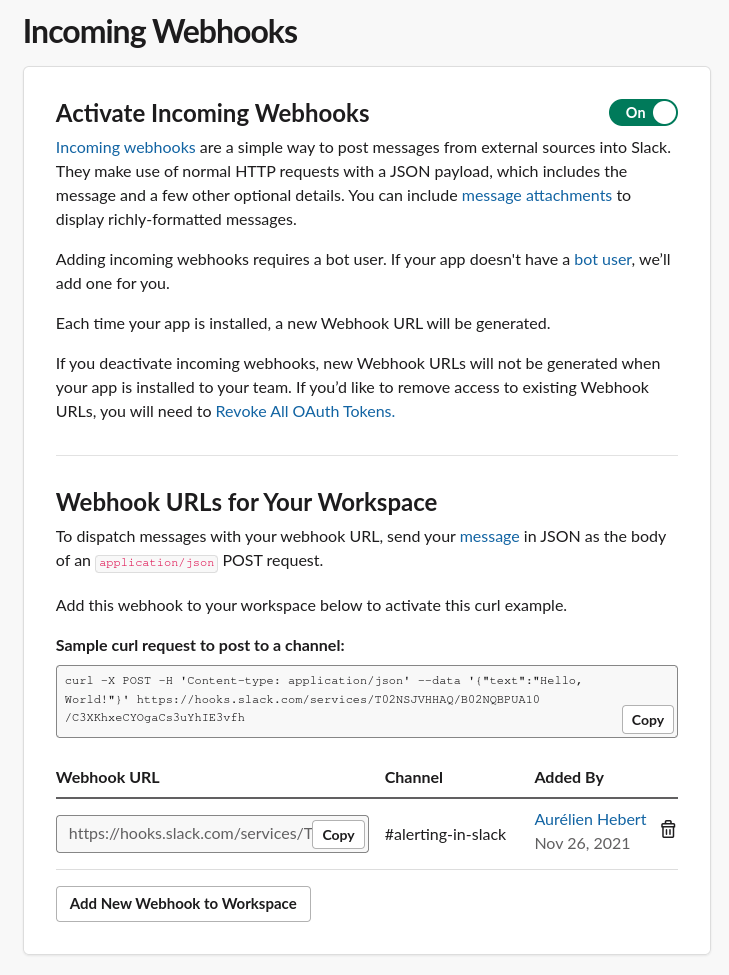
Simply copy the web hook URL and then go to the alerting main panel (bell on the left) and add a new slack notification channel. Configure it as done below, within the field web hook URL, the one from the slack application. You can set your own custom name.
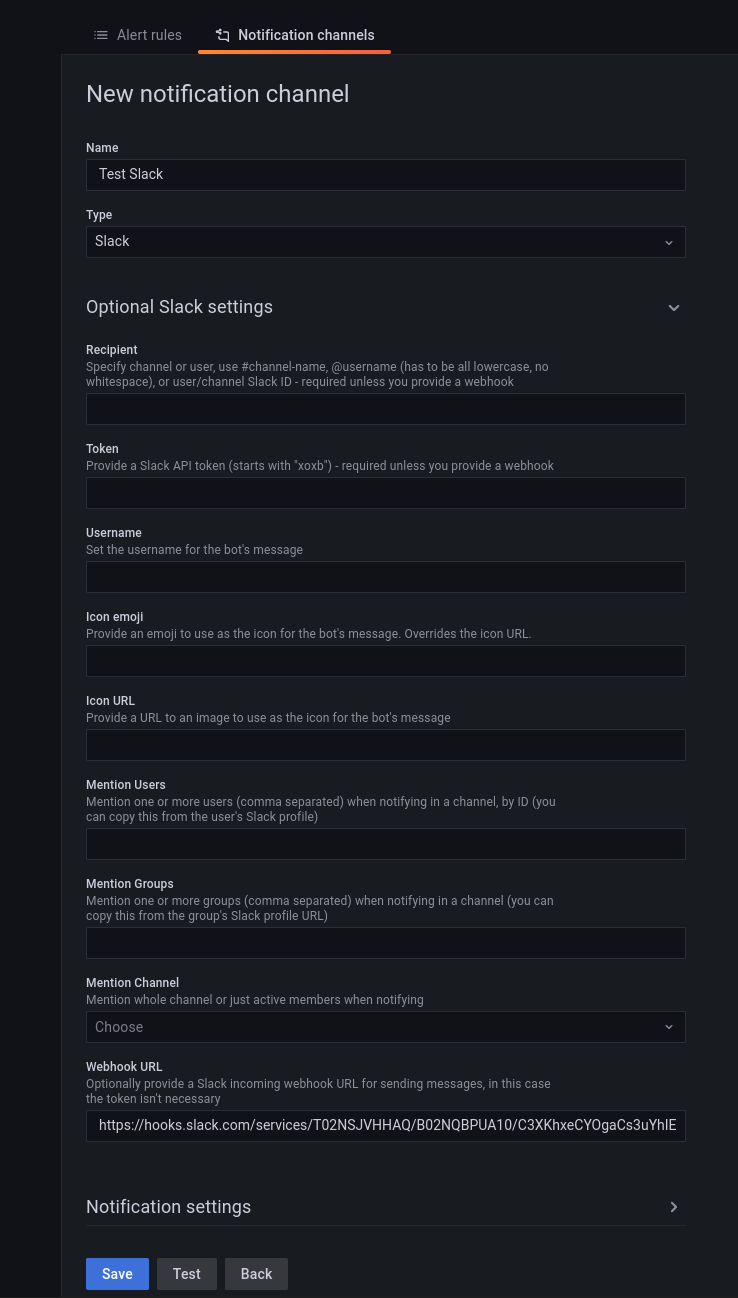
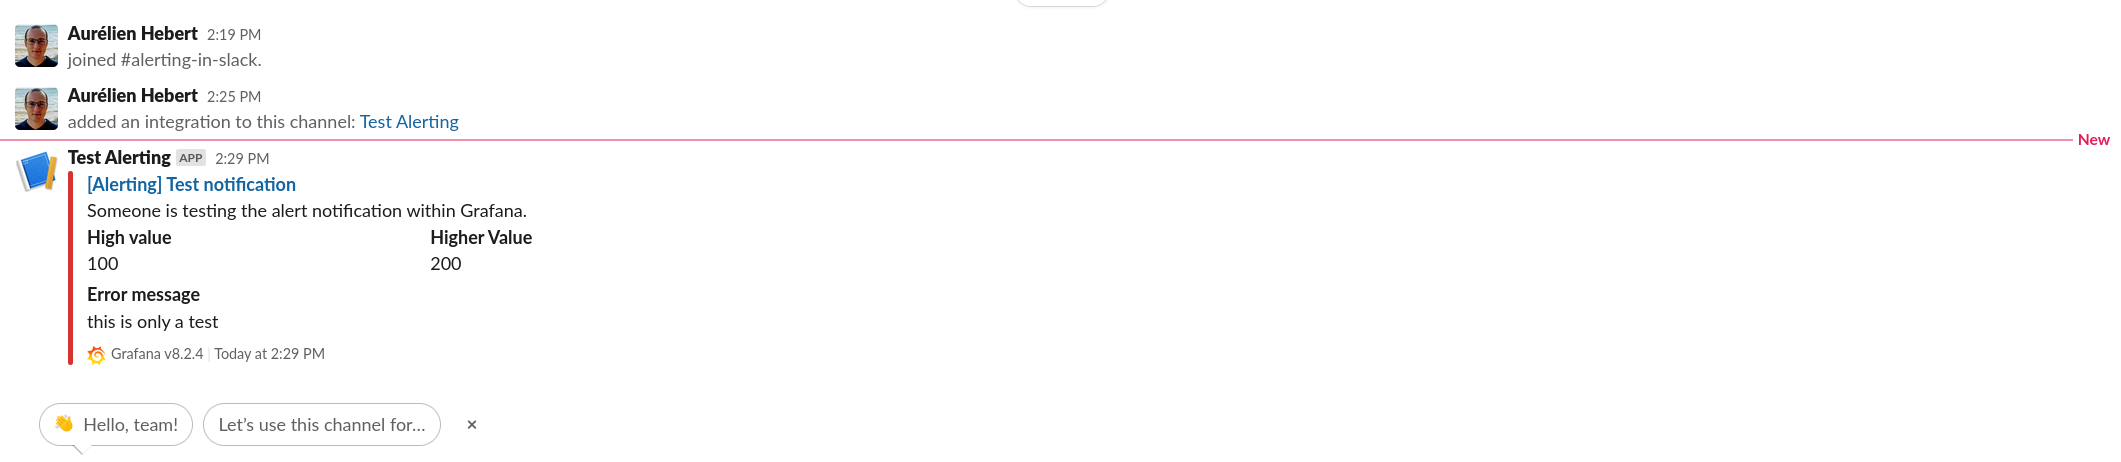
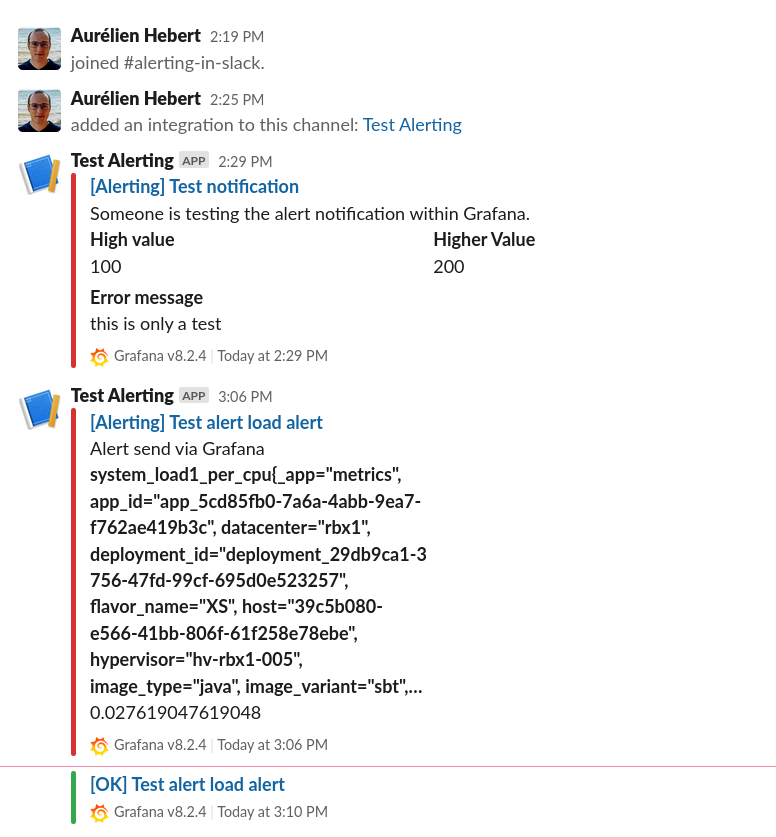
Before you validate, you can test your slack integration with the Test button. Without delay, in the configure slack channel, you will receive a test message.
Grafana Alerting
Now that we have enabled an alert notifier, let’s create an alert in Grafana.
Clever Cloud Available Metrics
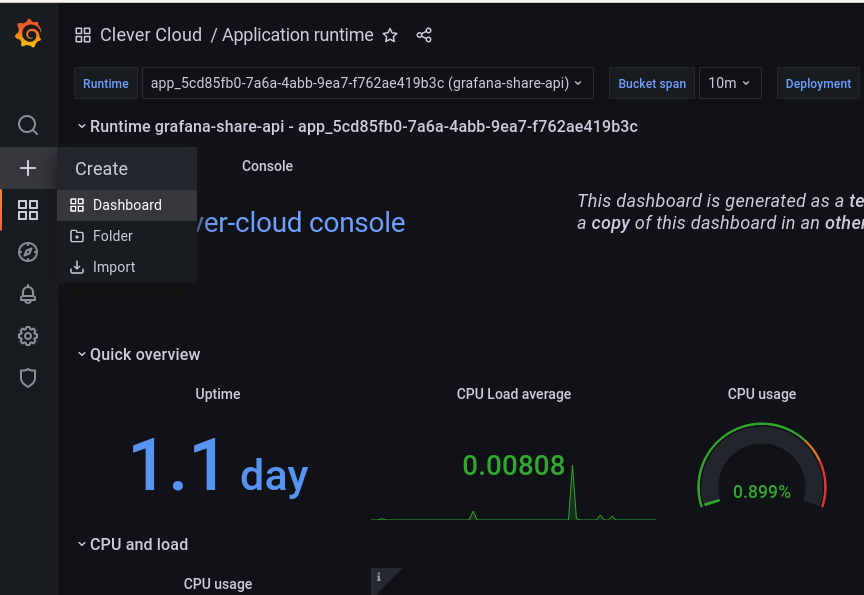
We will start from one of the template dashboards we release with Grafana. We deployed a preview application on a Clever Cloud organisation.
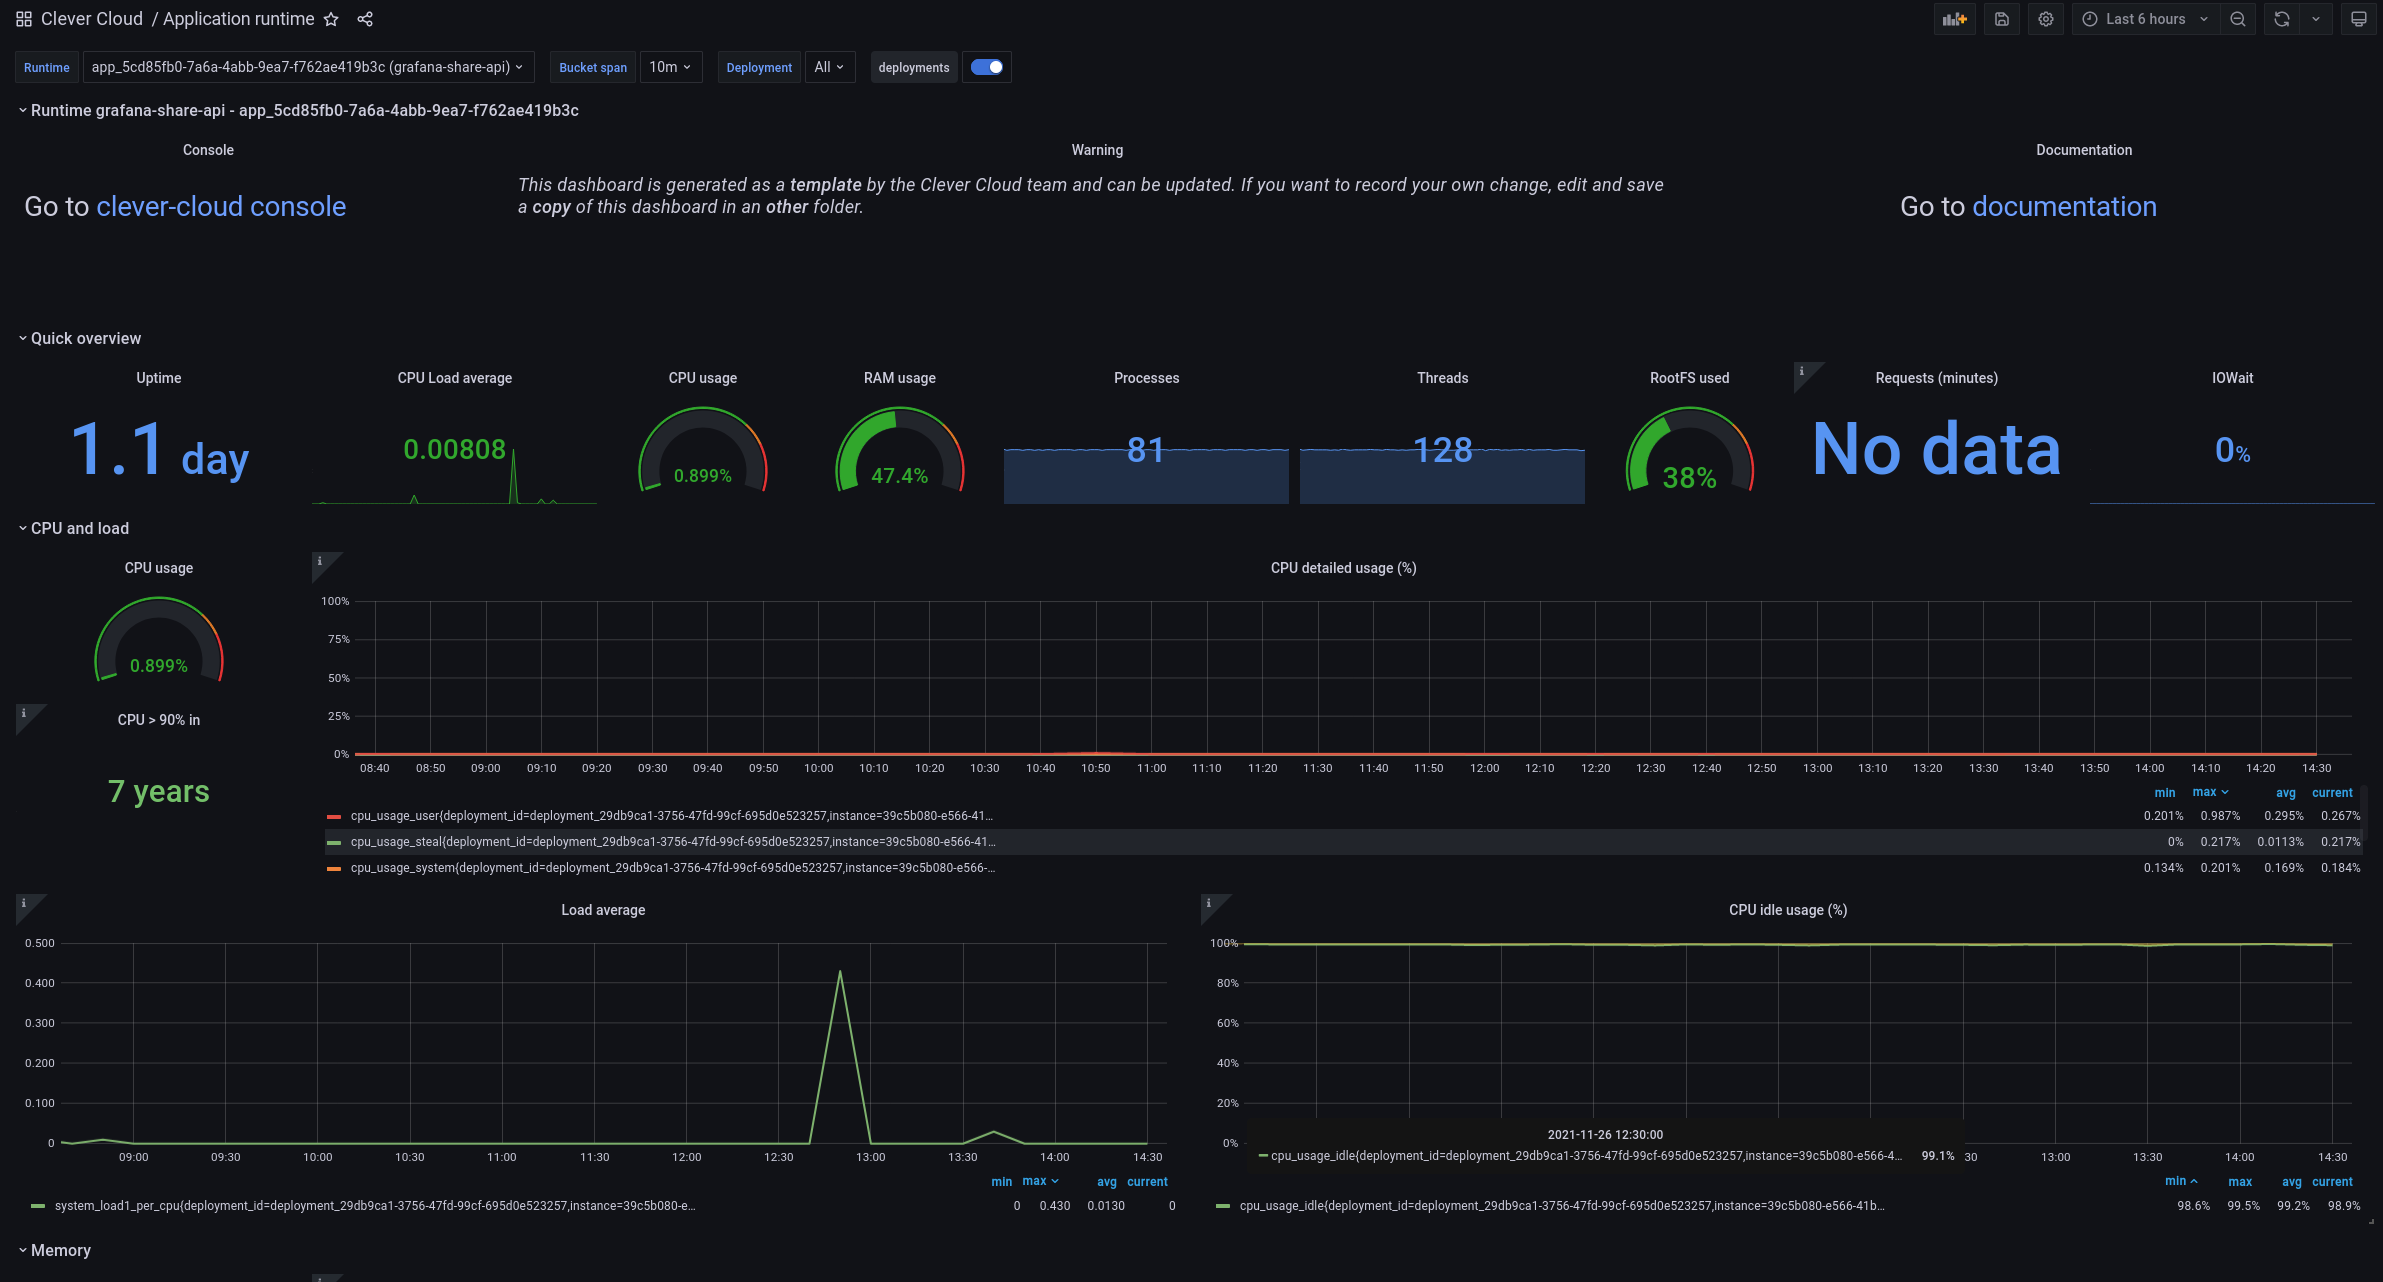
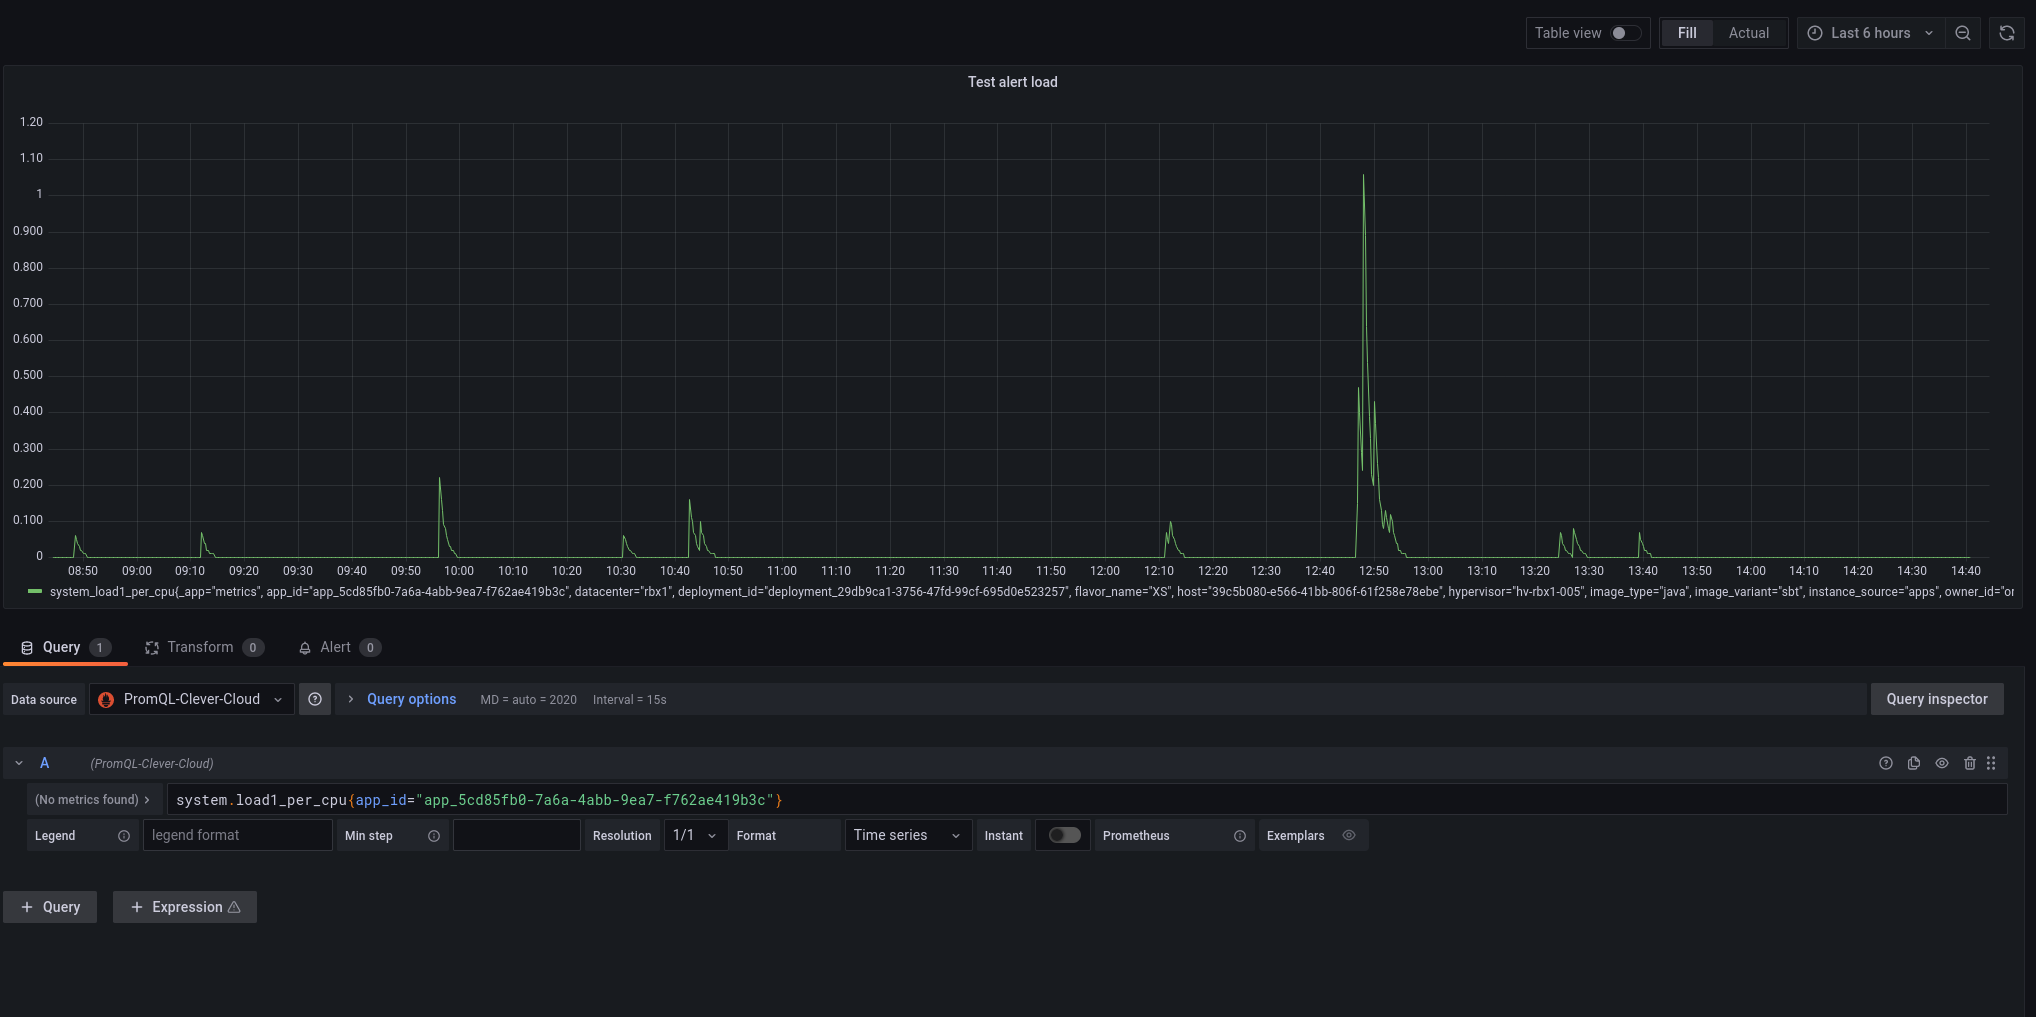
For the rest of this post, we will work on the load average metrics. As we can see below, it’s a simple PromQL query. However, it includes custom dashboard variables APP_ID and DEPLOY_ID that are not supported in Grafana alerting!
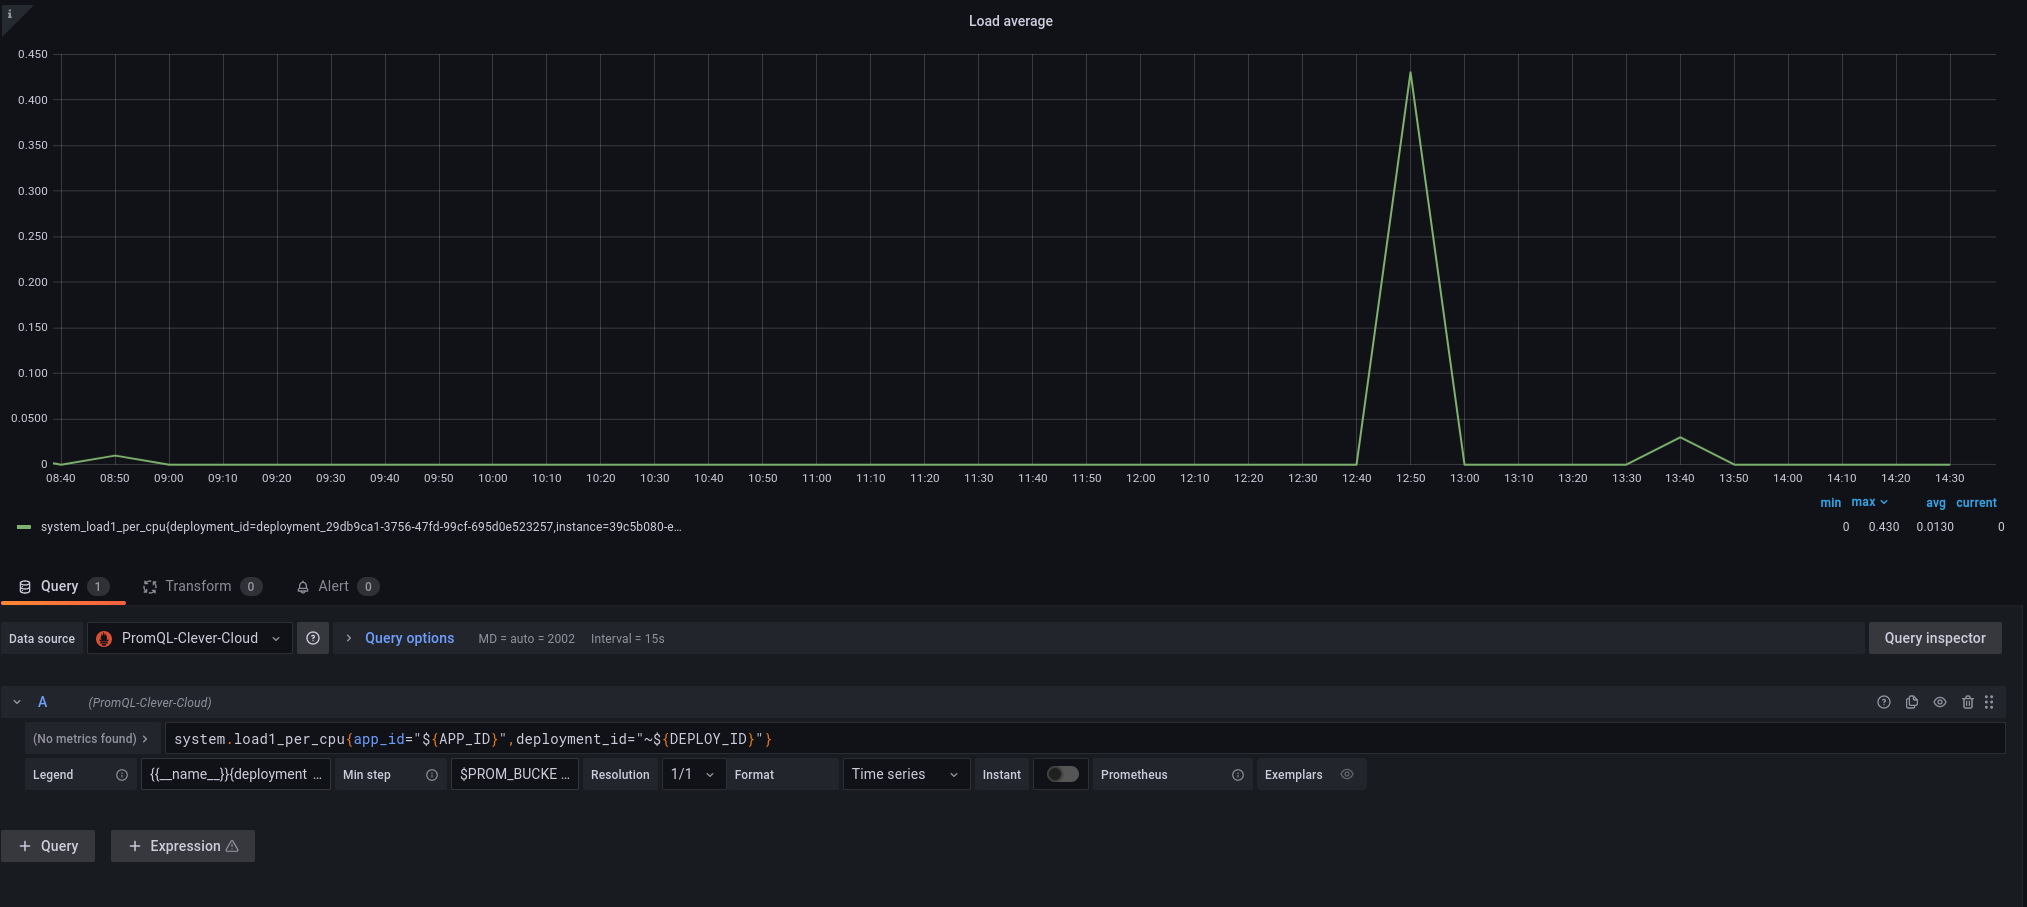
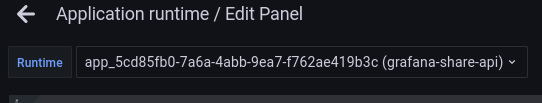
Before enabling the alerting, we will keep somewhere this graph query system.load1_per_cpu{app_id="APP_ID"}. I will only replace the variable APP_ID by its value, which is available on top of the dashboard.
Then in order not to have our custom alerts removed at each update of the Clever Cloud dashboard templates, create a new dashboard.
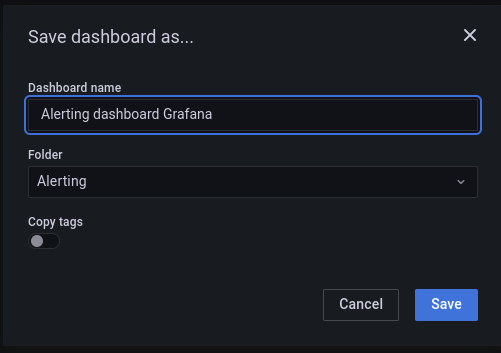
Also save it in a dedicated dashboard which is not Clever Cloud, in our example, it’s alerting.
Finally, in this new dashboard create the same load graph with the query system.load1_per_cpu{app_id="APP_ID"}. As well as seen previously replace APP_ID by your own application ID. For the data source, select the PromQL one.
Set Up The Alerting
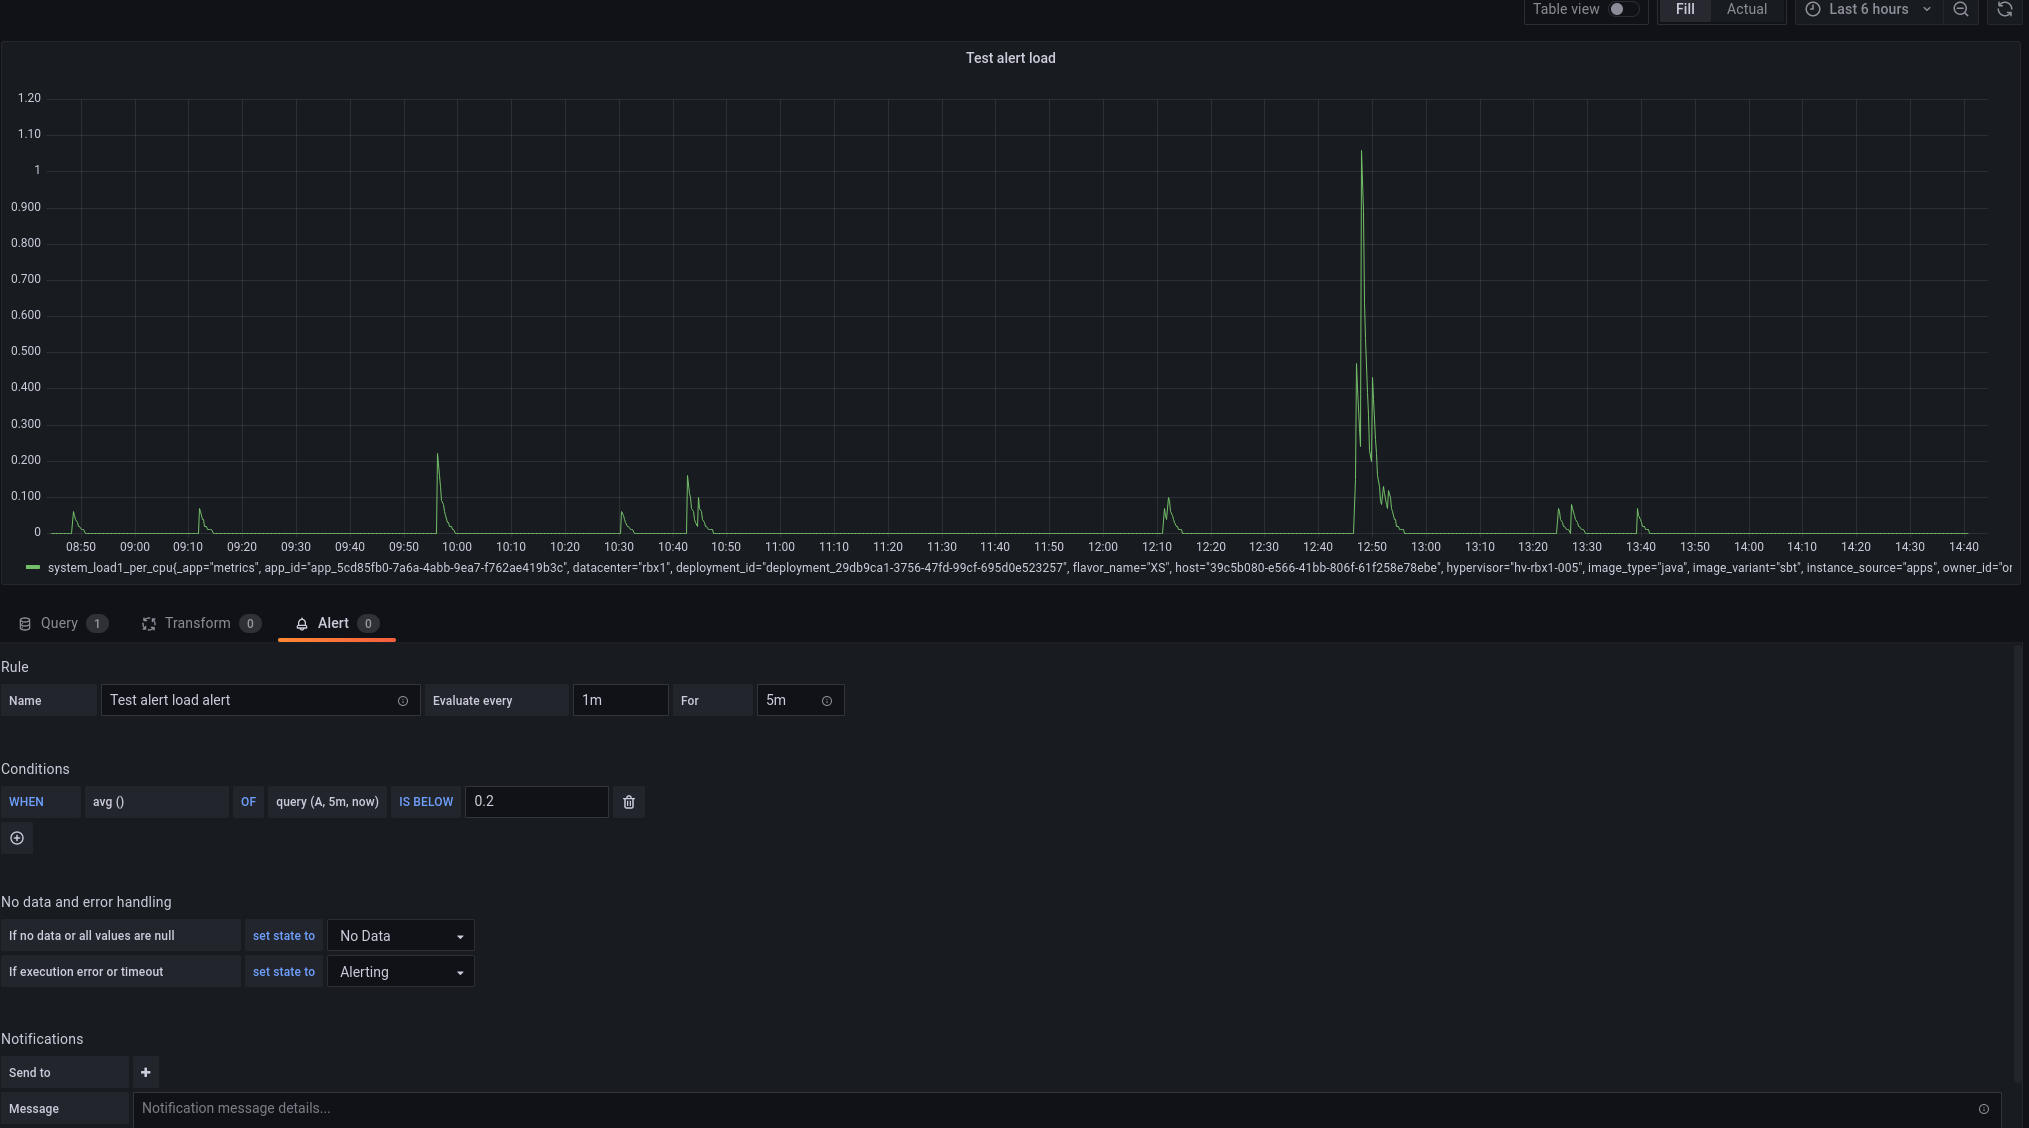
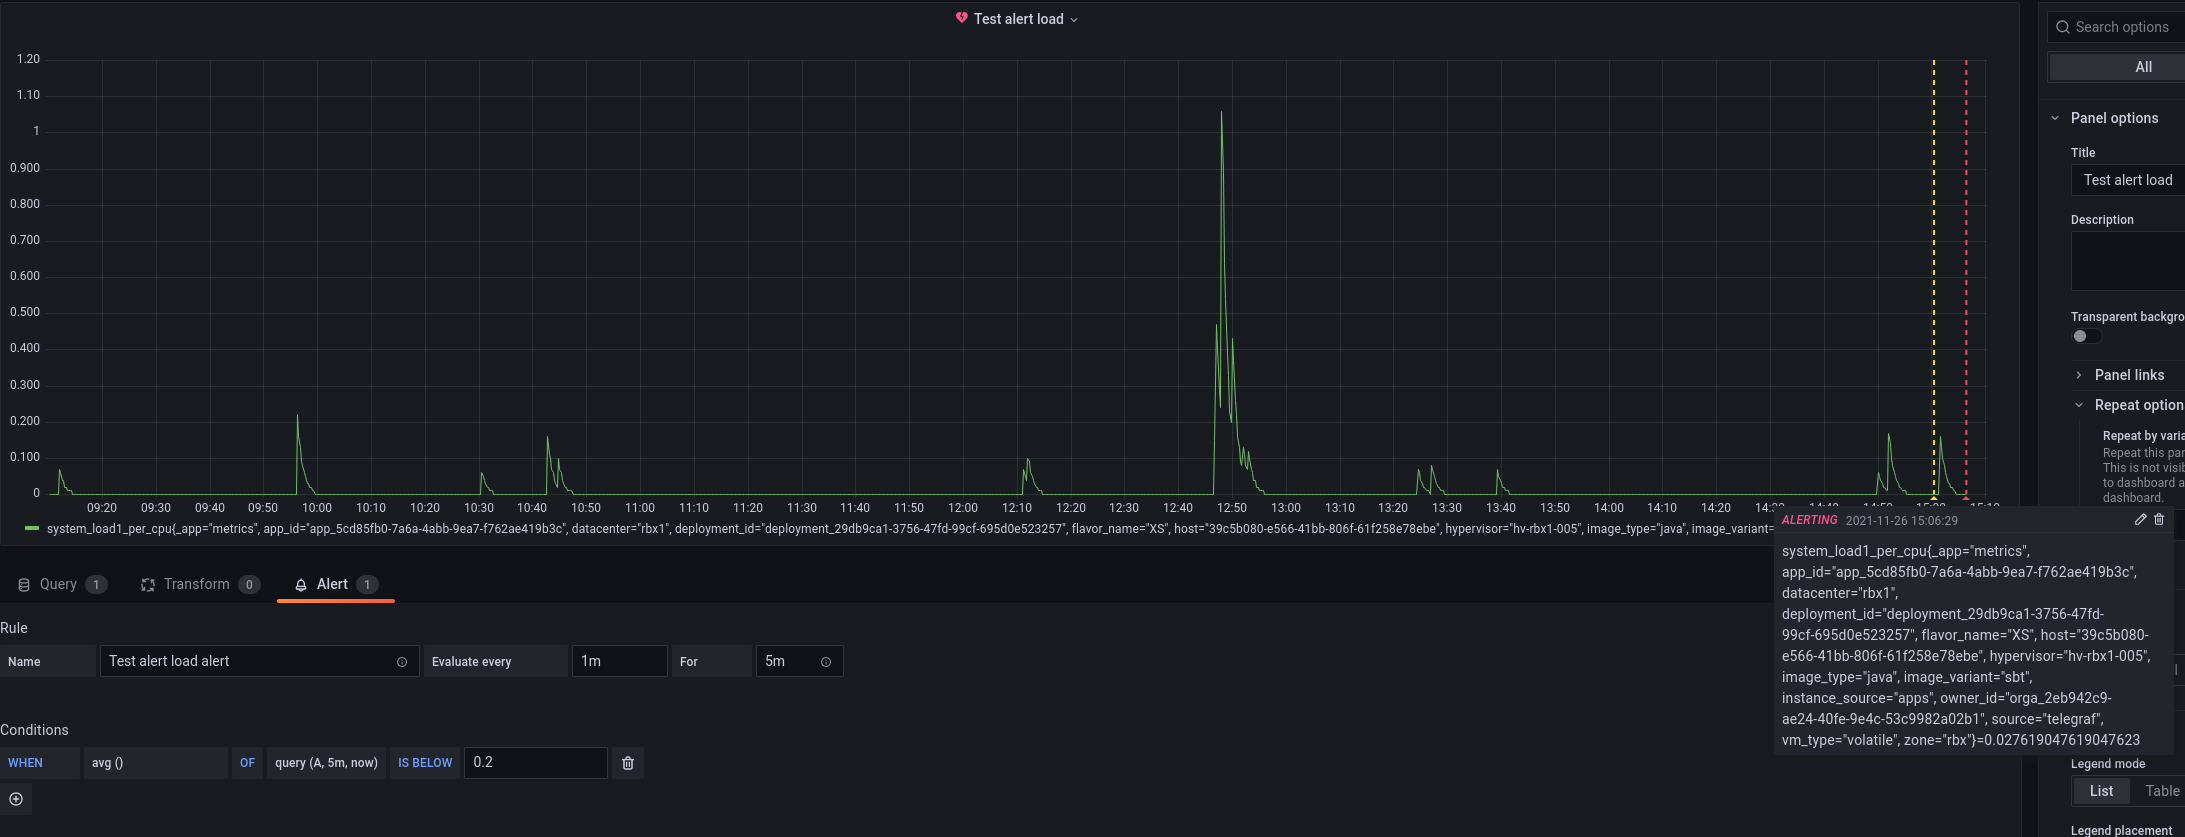
At this instant we have a new graph where we can set up a first alert on the load of our application. For that, go on the Alert panel, and configure the alert based on the parameter you want. Quickly, to get an alert working, I set up the condition to check if my metrics are below the value 0.2.
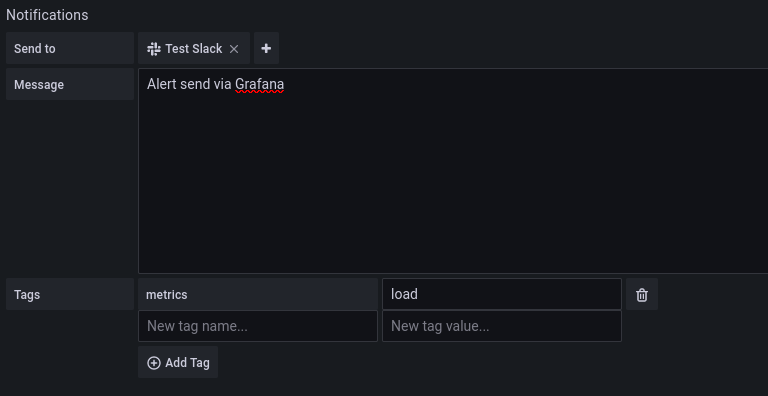
Then still on the Alert panel add the notifier you created in the first section. Here, you can customise the alert you will receive in slack: adding a message and custom tags.
Once you have set up your alert, you can test the rule with the test rule button.
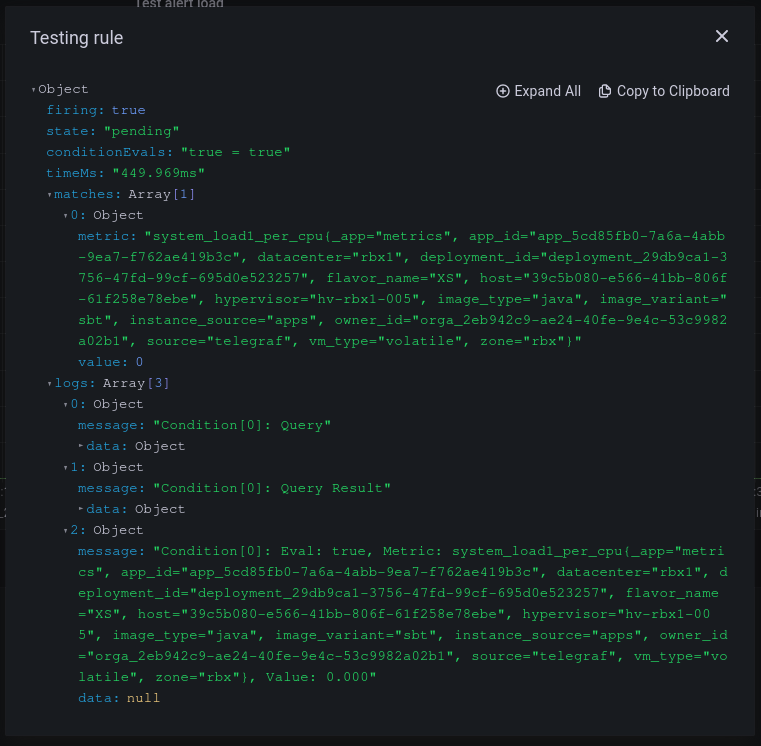
Next all you have to do is to wait for an alert to appear on Slack! Besides each alert state change will be ploted on the alert graph. After about five minutes, as I was clearly matching my alert state condition, I got two states change: one pending and one alerting.
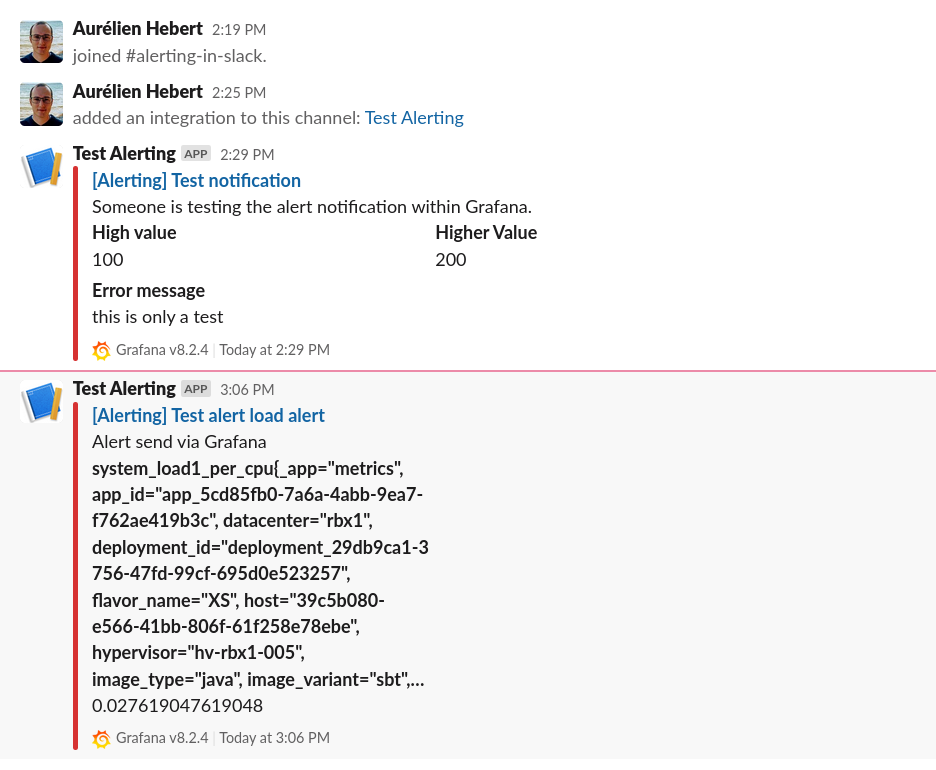
As soon as the alert state happens, a slack message is sent through the notifier.
Finally, I would like to retrieve a more ‘normal’ state. To do it, I update my alert condition and set it to above 0.8, which is a more classical value for an alert threshold for the load metrics.
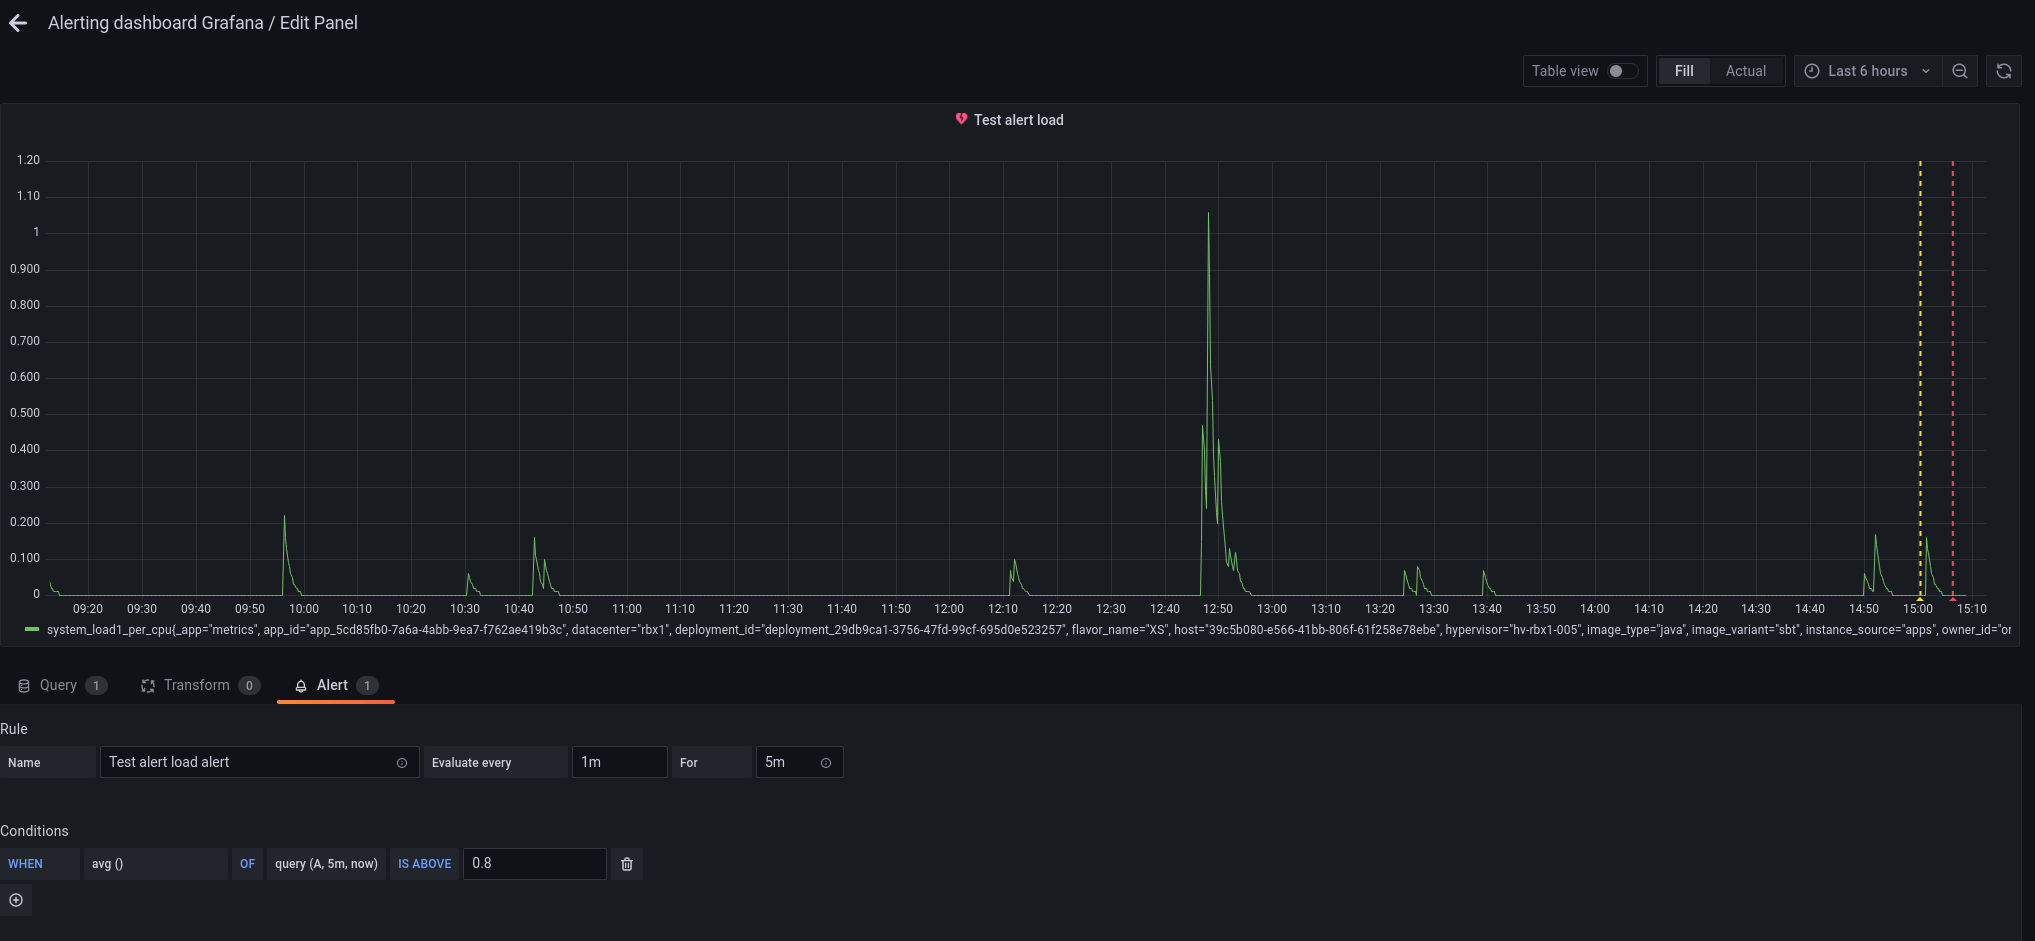
Instantly or almost, the state of the alert should change and comes OK!
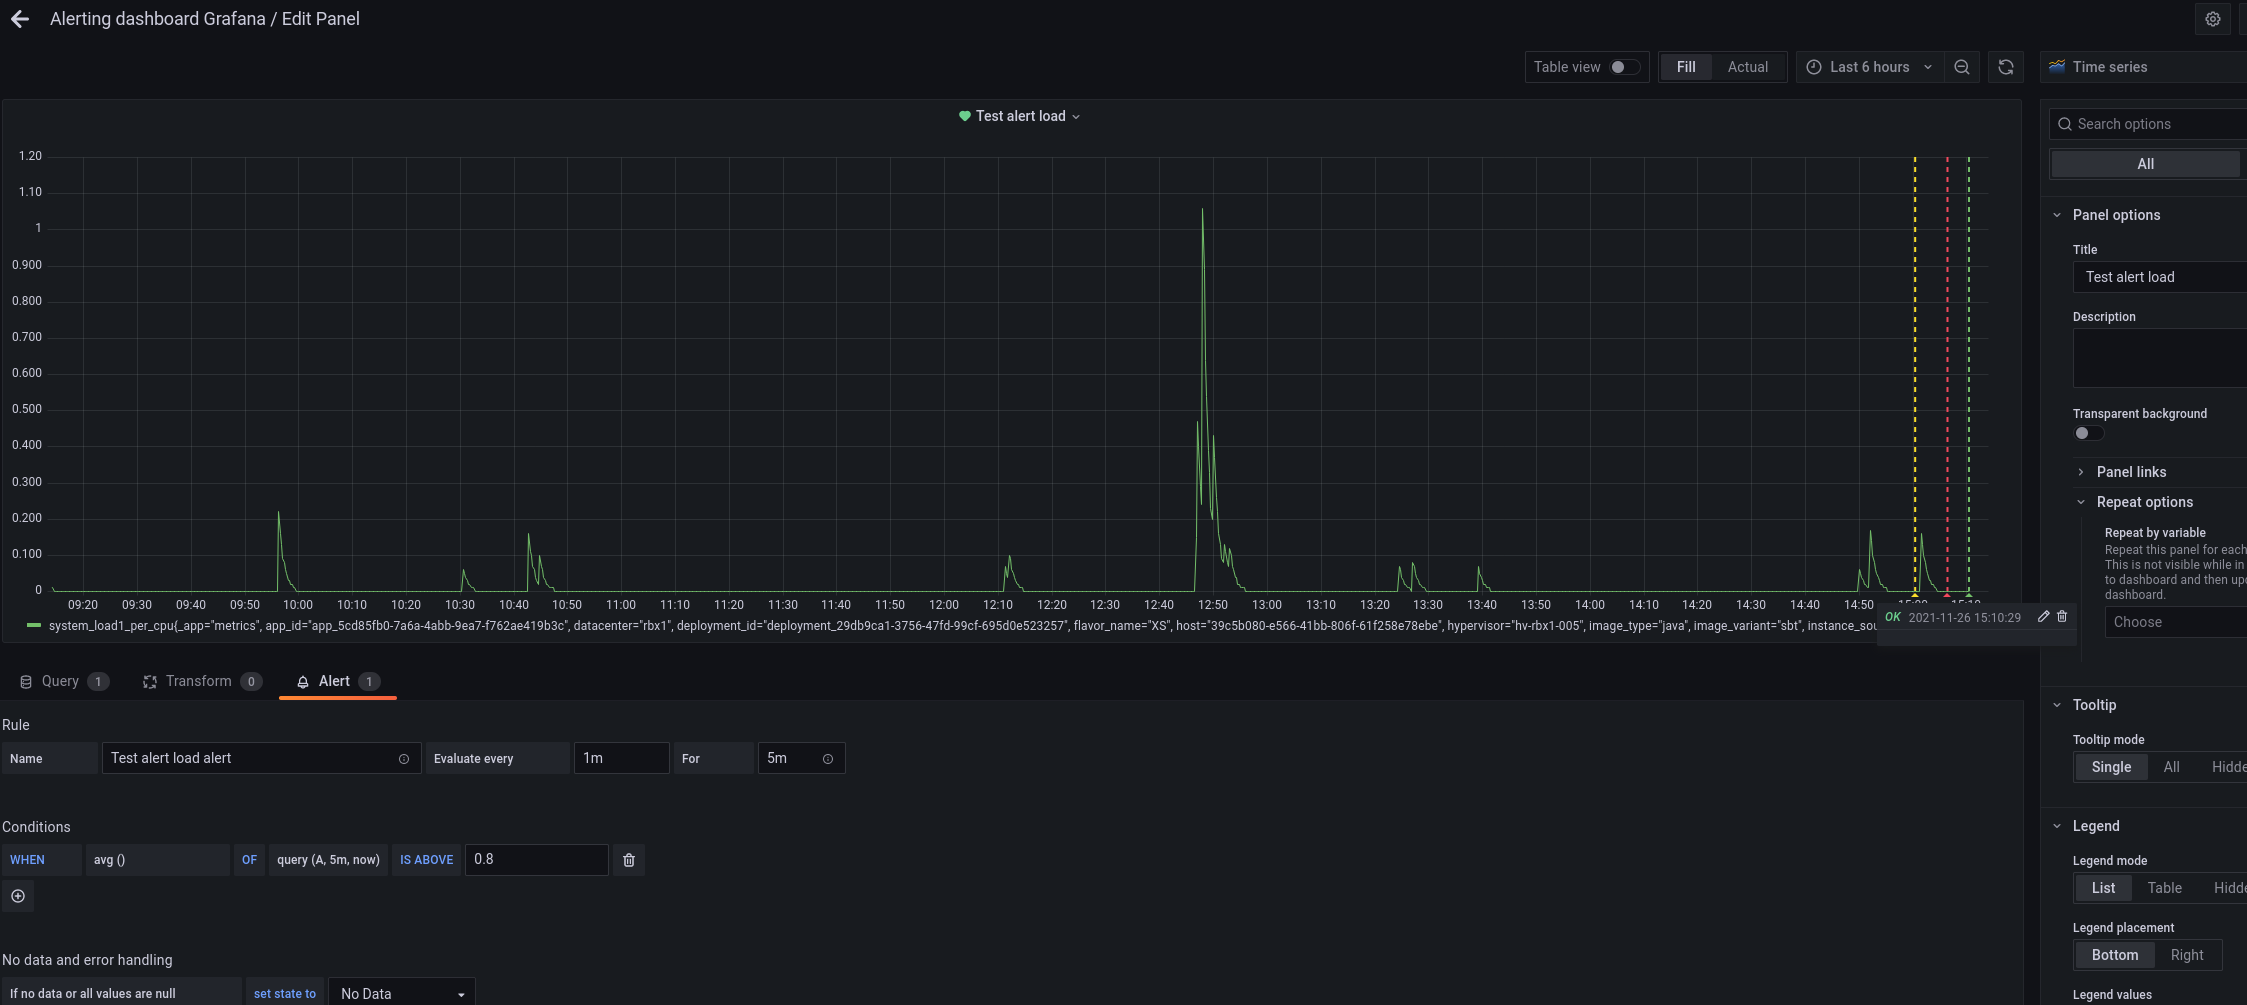
Immediately after Grafana also send a message to slack to end the issue!
To Sum Up
You should now be able to configure your own alerts on Slack for Grafana! You can play with the pending time, the alert condition, when to trigger the alert, the alert message the tags and so on. In fact, all you need is a working PromQL query. Nonetheless remember that the Grafana alerting doesn’t support dashboard variables. Other than that, you should be able to custom the alert as you wish!
I hope you enjoy and feel free to share with us your thought on the Alerting and the Metrics product. We will be happy to have your feedback. You can contact me directly on twitter, or send us a message through the metrics overview comments.